
Search for articles
Understanding Dashboard Metrics
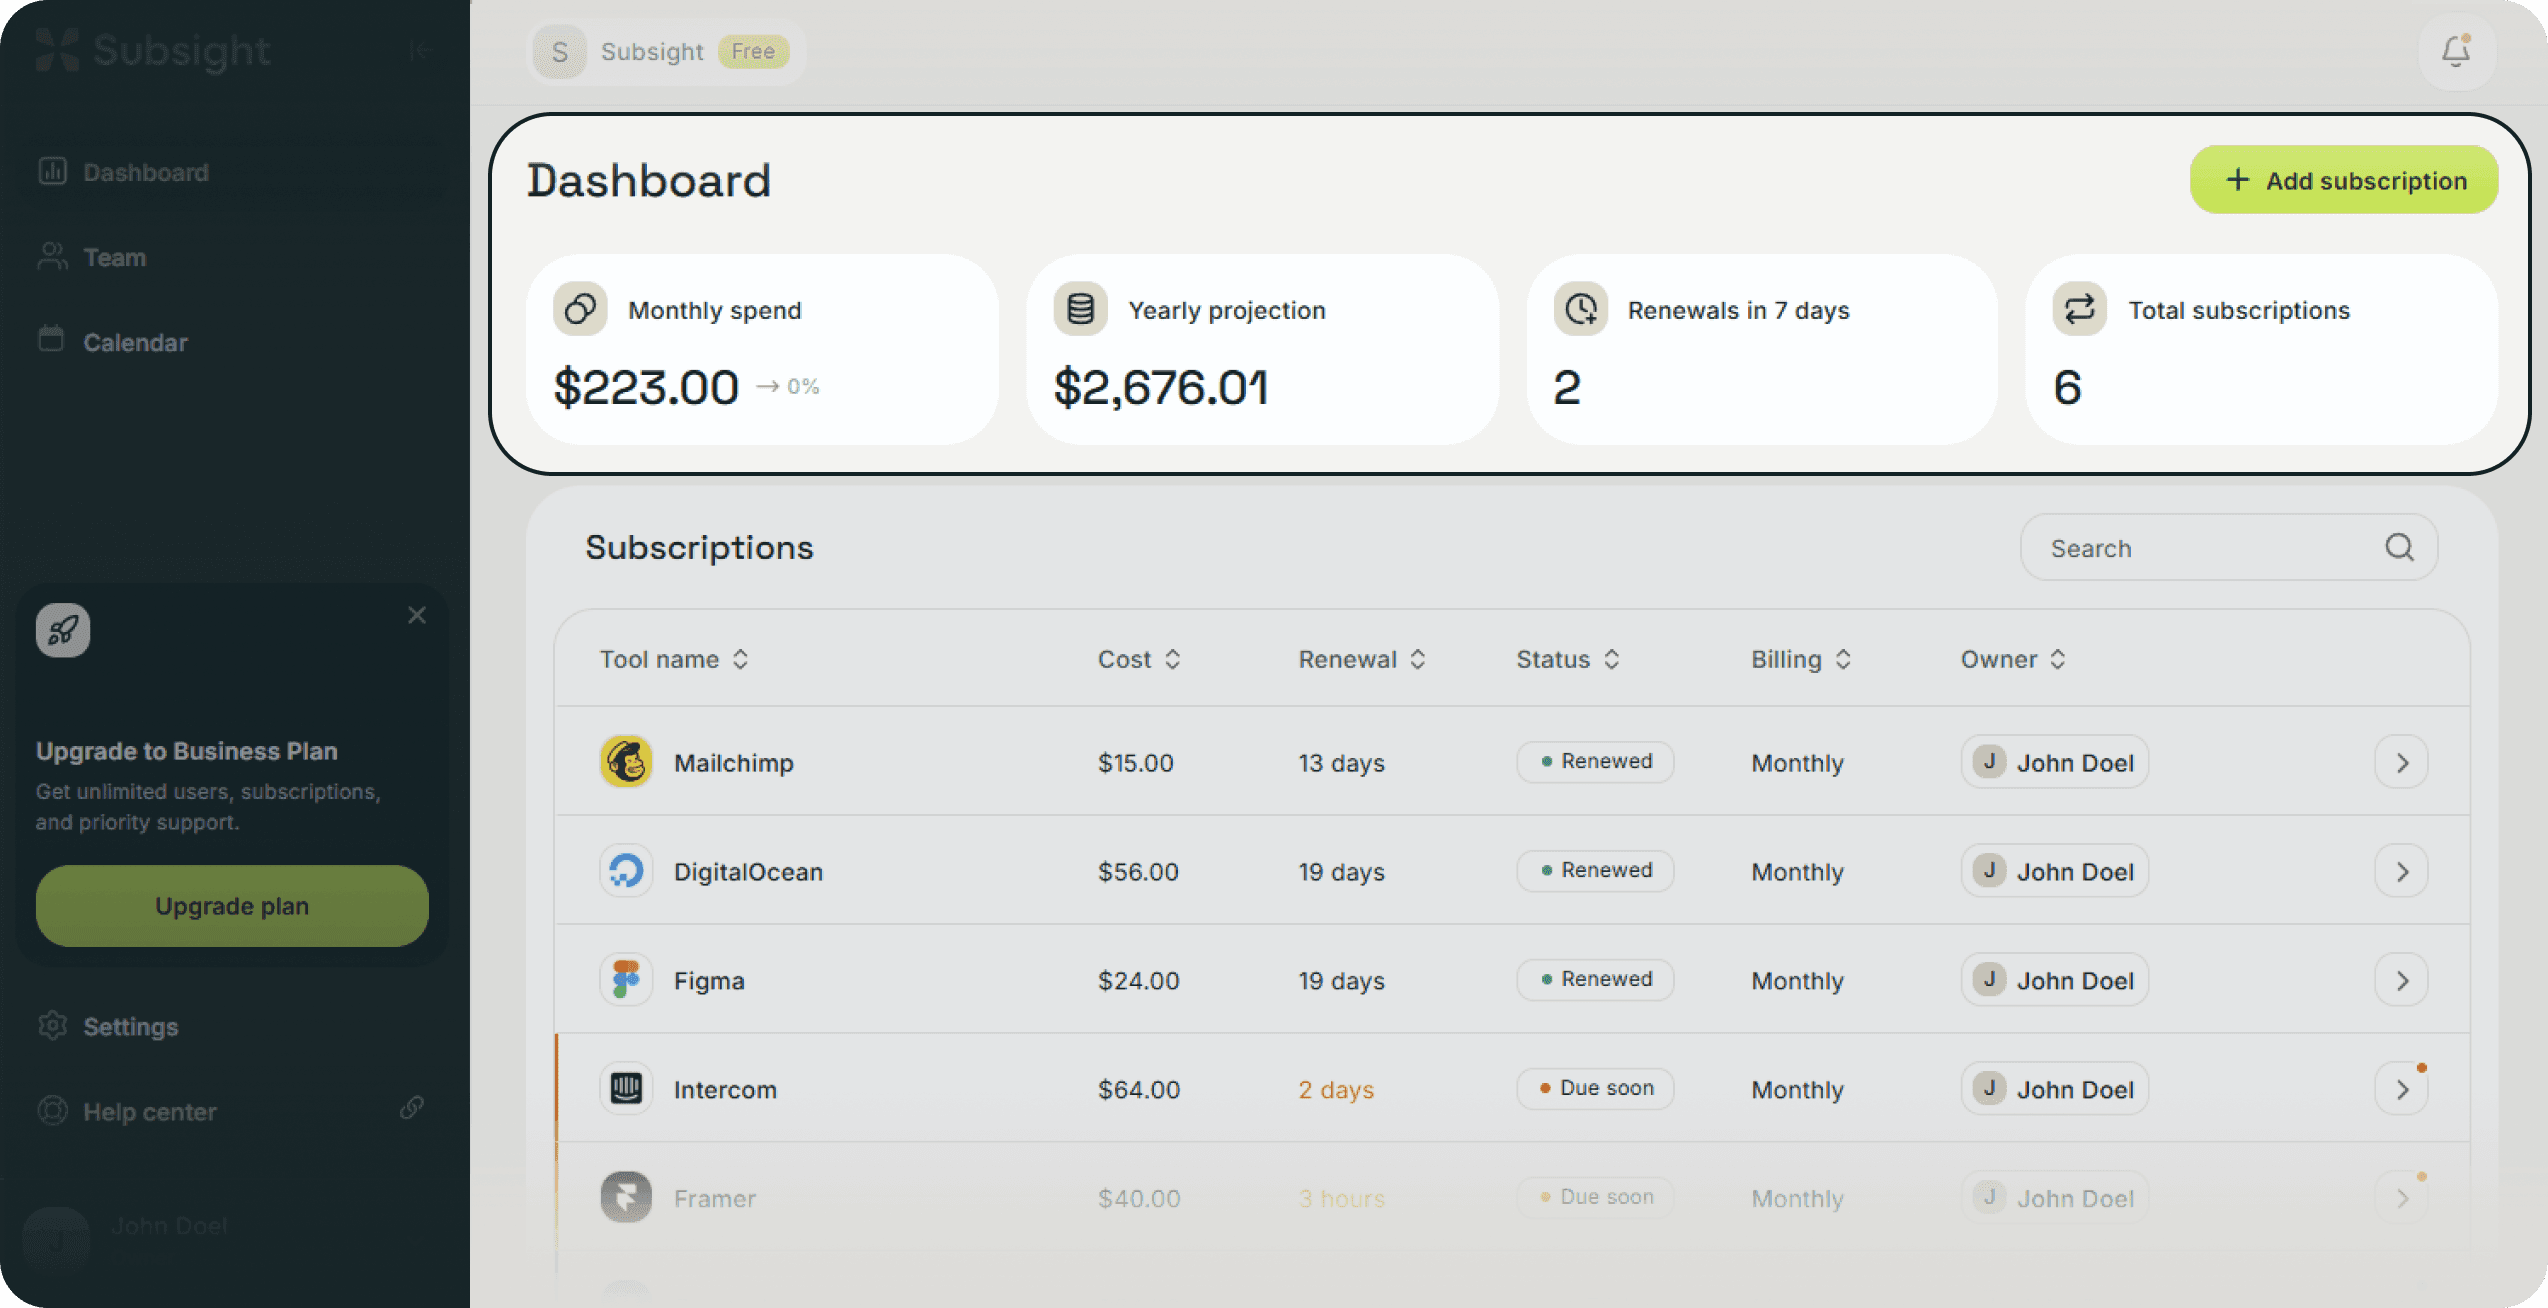
The metrics at the top of your dashboard provide a real-time summary of your workspace's financial health and operational status. These figures update instantly as you manage your subscriptions.
Written by Petras Nargela
Written by Petras Nargela
Last updated on
1. Financial Spend Metrics
The first two cards focus on your budget and burn rate using distinct calculation methods:
Monthly spend: This represents your "current burn". It totals all active subscriptions that have a payment due within the current calendar month. For example, if you are viewing the dashboard in February, this figure reflects all renewals scheduled between the 1st and the last day of February.
Yearly spend: This is your "12-month projection". Rather than simply multiplying your monthly total by 12, this figure aggregates the expected cost of all active subscriptions over a full year. This ensures that annual contracts (which may not be due this specific month) are still captured in your long-term budget commitments.
2. Trend Indicators
Next to each spend amount, you will see a small percentage indicator (e.g., -> 0%). These indicators compare your current financial data to the previous period:
Monthly Trend: Compares the total cost of subscriptions in the current month to the total cost of subscriptions in the previous month.
Yearly Trend: Compares your current 12-month projection to the projection as it stood 30 days ago.
A positive percentage indicates your software costs have increased, while a negative percentage shows a decrease in your budget commitments.
3. Operational Metrics
The remaining cards help you manage your upcoming tasks and the size of your stack:
Renewals next 7 days: This card looks at a rolling 7-day window from today. It tells you exactly how many individual payments require confirmation in the immediate future to prevent them from becoming "Overdue".
Total subscriptions: The count of all active tools currently tracked in your workspace. Note that tools with a Cancelled status are excluded from this total to provide an accurate count of your live stack.